Showing posts with label KLCI Charts. Show all posts

Monday, May 9, 2011

Wednesday, April 20, 2011

KLCI 2 years ( 21Apr2009 - 20Apr2011 )


Look at the Green and Red line... beware if these lines cross each others!!

Wednesday, January 26, 2011

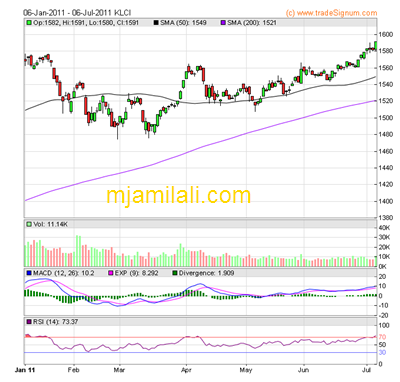
6 consecutive days Bearish and RSI dropped lowest


This is the best time to make a top up or start a new Investment.
RSI has touch lowest..
* this is a personal opinion, you should do your personal evaluation and get advice from the expert. Get your own personal financial adviser if you have not do so.
Friday, March 26, 2010

Friday, January 29, 2010

Wednesday, January 20, 2010

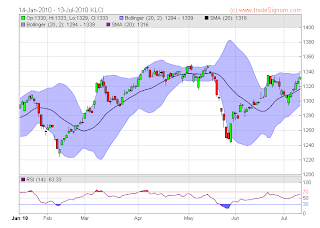
Chart of KLCI up to 20 Jan 2010


Do you realise? It is a sign of Moving Up Trend.... Apa lagi start pumping your money now.

Tuesday, September 8, 2009


As I predicted in early July 2009. Yesterday KLCI already hit 1200 points before end of Sept.
Thank you to all of you (clients) who believe and take my word and gain a lot from this Market Bull. Congratulate!